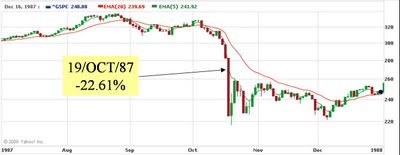
1. Black Monday, Oct 19, 1987: 22.6%
2. -13.47% 10/28/1929
3. -11.73% 10/29/1929
4. -10.73% 10/05/1931
5. -9.92% 11/06/1929
6. -8.40% 08/12/1932
7. -8.10% 01/04/1932
8. -8.04% 10/26/1987
9 -7.87% 06/16/1930
10. -7.84% 07/21/1933
Sin embargo, estos días tan críticos vienen precedidos de señales de aviso.

Por ello, cuando gestionamos un Portfolio y nuestro sistema nos da señal de venta, es muy importante cubrirse (SIEMPRE) por lo que pudiera pasar.
A continuación podemos ver un resumen de los 10 peores Mercados Bajistas y su duración
(fuente: http://stocktaleslot.blogspot.com/2006/10/10-worst-stock-market-crashes-in-us.html)
Por cierto, la mayoría de estos movimientos bajistas comenzaron en Septiembre o Noviembre.
10th Worst Stock Market Crash: 2000 - 2002
Key events: Tech bubble bursting, September 11th terrorist attack
Date Started: 1/15/2000Date
Ended: 10/9/2002
Total Days: 999
Starting DJIA: 11,792.98
Ending DJIA: 7,286.27
Total Loss: -37.8%
9th Worst Stock Market Crash: 1916 - 1917
Key events: US being drawn into World War 1
Date Started: 11/21/1916
Date Ended: 12/19/1917
Total Days: 393
Starting DJIA: 110.15
Ending DJIA: 65.95
Total Loss: -40.1%
8th Worst Stock Market Crash: 1939 - 1942
Key events: World War 2, attack on Pearl Harbor
Date Started: 9/12/1939
Date Ended: 4/28/1942
Total Days: 959
Starting DJIA: 155.92
Ending DJIA: 92.92
Total Loss: -40.4%
7th Worst Stock Market Crash: 1973 - 1974
Key events: Vietnam war, Watergate scandal
Date Started: 1/11/1973
Date Ended: 12/06/1974
Total Days: 694
Starting DJIA: 1051.70
Ending DJIA: 577.60
Total Loss: -45.1%
6th Worst Stock Market Crash: 1901 - 1903
Key events: Assassination of President William McKinley; a severe drought causing alarm about US food supplies
Date Started: 6/17/1901
Date Ended: 11/9/1903
Total Days: 875
Starting DJIA: 57.33
Ending DJIA: 30.88
Total Loss: -46.1%
5th Worst Stock Market Crash: 1919 - 1921
Key events: Followed a post war boom, bursting of the first big tech bubble- the automobile sector (but after bottoming, this decade saw tremendous growth in the stock market and the economy, often called the roaring twenties)
Date Started: 11/3/1919
Date Ended: 8/24/1921
Total Days: 660
Starting DJIA: 119.62
Ending DJIA: 63.9
Total Loss: -46.6%
4th Worst Stock Market Crash: 1929
Key events: End of the roaring twenties, and kicked off the Great Depression
Date Started: 9/3/1929
Date Ended: 11/13/1929
Total Days: 71
Starting DJIA: 381.17
Ending DJIA: 198.69
Total Loss: -47.9%
3rd Worst Stock Market Crash: 1906-1907
Key events: The "Panic of 1907" due to a credit crunch in New York, as well as gloom due to President Roosevelt's antitrust drive
Date Started: 1/19/1906
Date Ended: 11/15/1907
Total Days: 665
Starting DJIA: 75.45
Ending DJIA: 38.83
Total Loss: -48.5%
2nd Worst Stock Market Crash: 1937-1938
Key events: Legacy of Great Depression, war scare and Wall street scandals
Date Started: 3/10/1937
Date Ended: 3/31/1938
Total Days: 386
Starting DJIA: 194.40
Ending DJIA: 98.95
Total Loss: -49.1%
Worst Stock Market Crash: 1930-1932
This is the grand daddy of them all. Investors lost 86% of their money over this 813 day beast. This market crash combined with the 1929 crash, makes up the Great Depression. If you had $1000 on 9/3/1929 (beginning of the 4th worst crash, it would have gone down to a whopping $108.14 by July 8th, 1932 (end of the worst crash) or an 89.2% loss. To recover from a loss like that, you would have to watch your portfolio go up 825%! The full recovery didn't take place until 1954, 22 years later!
Date Started: 4/17/1930
Date Ended: 7/8/1932
Total Days: 813
Starting DJIA: 294.07
Ending DJIA: 41.22
Total Loss: -86.0%


