Re: Farmas USA
A Guide to Trading with Stochastic Indicators
Stochastic- Definition, Applications and Much More
Stochastic Definition
What is Stochastic?
I write mostly about price action, candles, support and resistance but have received a lot of requests about a few indicators. Stochastic is the first indicator I want to cover thoroughly. If you are not using indicators in your trading, it is still worth it to know how traders use them. This will expand your understanding of the markets in general. So, what is the definition of Stochastic?
Stochastic- it is an oscillator that is a momentum indicator that is comparing the closing price of a security to the range of its prices over a certain period of time. Seeing nature through the lens of probability theory is what mathematicians call the stochastic view.The word comes from the Greek stochastes, a diviner. It in turn comes from stokhos, a pointed stake used as a target by archers.
Breaking it Down
How do you calculate Stochastic? There is a formulae calculating it and it is:
Where:
C = the most recent closing price
L14 = the low of the 14 previous trading sessions
H14 = the highest price traded during the same 14-day period
%K= the current market rate for the currency pair (a.k.a. Fast %K)
%D = 3-period moving average of %K (a.k.a. Slow %D)
The connotation is when the market is in an uptrend, the prices are close to the high; when the market is in a downtrend, the prices are close to the low.
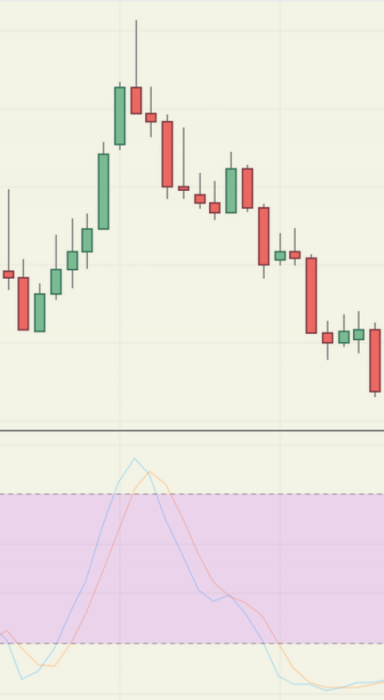
As I wrote before, when the price is in an uptrend, the oscillator is close to its high. As you can see on the example taken from a EURUSD chart above. When the price is in a downtrend, the Stochastic is near its low values as can be seen on the screenshot above.
By definition, Stochastic is measuring the speed or rate of acceleration of a security. In extremely fast markets (as can be seen above) the Stochastic’s angle is sharper. As you can see, the Stochastic is almost vertical. When the price slows down, the indicator is reflecting that change and is steepening out. The default settings of the stochastic are 14 and 5 periods. These readings are the absolute high/low for that period compared to the closing price. Other commonly used parameters for “K” are: 15, 10 or 5 days!
PART II Stochastic- Definition, Applications and Much More
Applications and Much More
Dr. George Lane, a financial analyst, is one of the first to publish on the use of stochastic oscillators to forecast prices. In his own words: “Stochastics measures the momentum of price. If you visualize a rocket going up in the air – before it can turn down, it must slow down. Momentum always changes direction before price.” 
As prices move down, the close of the day has a tendency to crowd the lower portion of the daily range. Just before you get to the absolute price low, the market does not have as much push as it did. The closes no longer crowd the bottom of the daily range. Therefore, Stochastics turns up at or before the final price low. Can we use this as an absolute holy grail indicator boding success? As you can imagine, the answer is more complicated than usual. A single indicator should not be used on its own. Traders should be looking for a combination of indicators and confluence of factors before executing a trade. No matter how tempting and simple it sounds to use a single indicator, you should be aware of the dangers that the markets incorporate in their daily gyrations.
Stochastic- Definition, Applications and Much More- Applications
Application #1
Bullish Signal
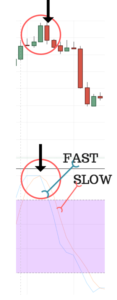
If the Fast K line pierces the slow line from south to north (on the left), we have a bullish signal. Market participants will be buying. 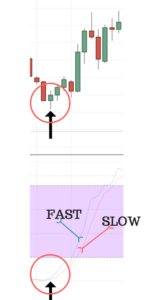
Bearish Signal
If the Fast line pierces the slow line from north to south (on the right), we have a bearish signal. Market participants are selling
Application #2:
Positive Divergence
Market participants are looking for a positive divergence when they are looking to buy. The divergence principles with Stochastic are the same as in any other oscillator’s divergence. We are looking for an extreme low level in the oscillator. The price should be making a new low, while the oscillator should be forming a higher low than the previous one. Have a look at the screenshot below:
Negative Divergence
Stochastic is giving a signal to sell when there is a negative divergence between price and the indicator. Traders are looking for an extreme reading in the indicator. There needs to be a higher high in the price chart corresponding to a lower second high on the indicator. Once this scenario is present, traders are selling by rule. 
In general, slowing down of the momentum is accepted by market participants as an exhaustion in the market and therefore change of market direction. It is easier said than done, so you must be extremely careful when taking trades. The general market environment and the macro trends should be taken under consideration. As I said before, Stochastic is a great indicator, but used on its own might lead to losses. Traders should consider using it in combination with other methods or time frames. Price action and support/resistance levels are crucial. Therefore, be extremely careful and check with your other indicators before placing a trade.
Application #3 Alternative Stochastic behaviour
A third way to view the Stochastic indicator is to check when it pops. A “ stochastic pop” is an event where price breaks out and keeps on going. This usually occurs in trending markets when the trend is very strong. It is usually interpreted by market participants as a signal to increase position in the way of the trend. Conversely, if you they had a contrarian position open, traders are liquidating it.
Stochastic- Definition, Applications and Much More- Applications
Overbought and Oversold Levels
A) Stochastic Overbought Levels
Like other oscillators, Stochastic is deviating between an overbought and an oversold level. An overbought level is defined by price reaching such a level that it is considered that the oscillator has reached its upper bounds. This is usually accompanied by higher volume. The overbought level for Stochastic is 80. Usually this level is considered to be a bearish sign, but it is hard to say just from the reading of the indicator. Usually, traders are looking for some of the above mentioned characteristics before executing a trade. Therefore, be extremely careful when using this indicator!
B) Stochastic Oversold Levels
The opposite of overbought is the oversold level. When Stochastic reaches an oversold level, it is thought to have reached its lower bounds. As is the case with the overbought, here too we have an increase of volume. The oversold level is 20. One major question remains- how do we know whether it is time to turn direction and start buying. Stochastic might not be enough, so you should use it either as a part of your trading strategy, or combine different time frames. It might be quite useful to check out some of my previous articles on technical analysis or on defining the trend.
Stochastic- Definition, Applications and Much More
Stochastic Versions
There are usually three versions of Stochastic.
- Fast- The fast version is the choppiest of all.
- Slow- The slow version is a smoothed version of the Fast one
- Full- The full stochastic is a customisable version of the slow stochastic
*Calculations
- Fast
Fast %K = %K basic calculation
Fast %D = 3-period SMA of Fast %K
- Slow
Slow %K = Fast %K smoothed with 3-period SMA
Slow %D = 3-period SMA of Slow %K
- Full
Full %K = Fast %K smoothed with X-period SMA
Full %D = X-period SMA of Full %K
Stochastic- Definition, Applications and Much More
CONCLUSION
As with any other indicator or trading method, using Stochastic is not a holy-grail of trading. If you are using this indicator, you should consider using it in combination with other tools. This article’s aim was to show you technical analysis from another angle. Using many indicators and messing up your charts is definitely not the solution- at least not for me. For the eager ones amongst you, this article should have hopefully revealed another side of trading. You should not forget that when trading, you should be trusting in your abilities more than anything else. Discipline is extremely important and money management and risk management should not be underestimated! You should be very risk averse, since capital is your only asset!


